

Drawing a Site Plan
What Is a Site Plan and Why Do You Need One?
A site plan is a scaled drawing showing the layout of your event on the chosen location. It indicates the position of all key elements – such as stages, seating areas, fencing, entrances, escape routes, catering areas, toilets, technical equipment, and electricity connections – drawn to scale on a map of the site.
The site plan serves two purposes
- Document for your permit applications – it should be appended to all official submissions, as it shows the approval authorities exactly how you intend to use the space.
- Practical planning tool – you can use it with your team and collaborators to set up the event on site.
Activating the Site Planner (Lageplaner)
The Site Planner is available to registered users and can only be activated within the context of an application you are already preparing.
When you log in and begin preparing an application with the Application Assistant, the Site Planner appears as an additional mode in the Space Map. You can switch between the Space Map and the Site Planner using the slider at the bottom centre of the map.
The Drawing Workspace
In the centre of the screen is the drawing area where you create your plan. You can select either the street map or a satellite image as the background, and draw the elements of your event directly on top.
You can zoom in and out to adjust the level of detail, and set the precise scale of the view using the numerical input on the left side of the header bar. When you select a drawing tool, a square frame appears on the map showing the boundaries of the final plan. Set your scale so that all elements of your event and any relevant context (roads, buildings, etc.) fall within this frame.
Drawing Tools
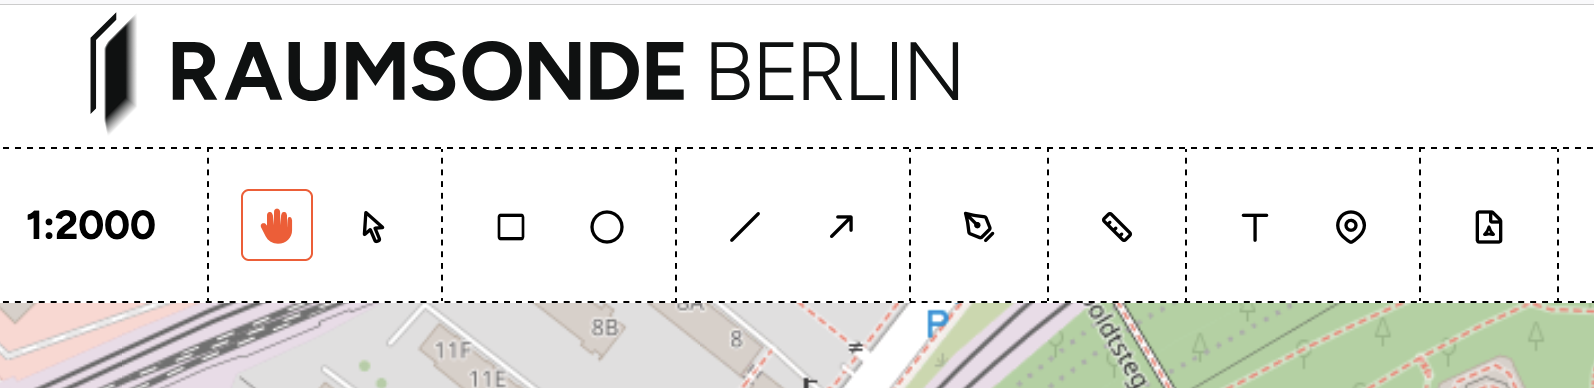
The header bar contains a series of tool icons for creating and editing your site plan. On the far left, the current scale of the drawing is displayed (e.g. 1:2000). The tools, from left to right, are:
Navigation and selection
- Pan (hand icon) – Click and drag to move around the map without altering your drawing.
- Select (pointer icon) – Click on a drawn element to select it, move it, or edit its properties.
Shape tools
- Rectangle – Draw rectangular areas to represent elements such as stages, seating areas, stalls, or containers.
- Circle – Draw circular or elliptical areas for elements such as roundabouts, gathering points, or circular enclosures.
- Line – Draw straight lines to represent boundaries, barriers, cable runs, or other linear elements.
- Arrow / Dimension line – Draw lines with arrows to indicate measurements, distances, or directional flow.
- Polygon – (pen tip icon) Draw freeform shapes with multiple points to represent irregularly shaped areas such as fencing perimeters, crowd zones, or custom layouts.
Annotation and symbols
- Measure (ruler icon) - Draw lines with measurement in meters.
- Text (T icon) – Add text labels to identify elements on your plan.
- Symbol / Marker (pin icon) – Add graphic symbols for infrastructure elements such as toilets, waste bins, fire extinguishers, water points, and similar.
Export
- PDF (document icon) – Switch to print mode to prepare and export your finished drawing. See Section Preparing and Exporting the Final Drawing for details.
You can combine these tools to build up a complete, labelled site plan. Each drawn element can be selected and adjusted using the properties panel on the right (see Section Adjusting Properties).
Adjusting Properties
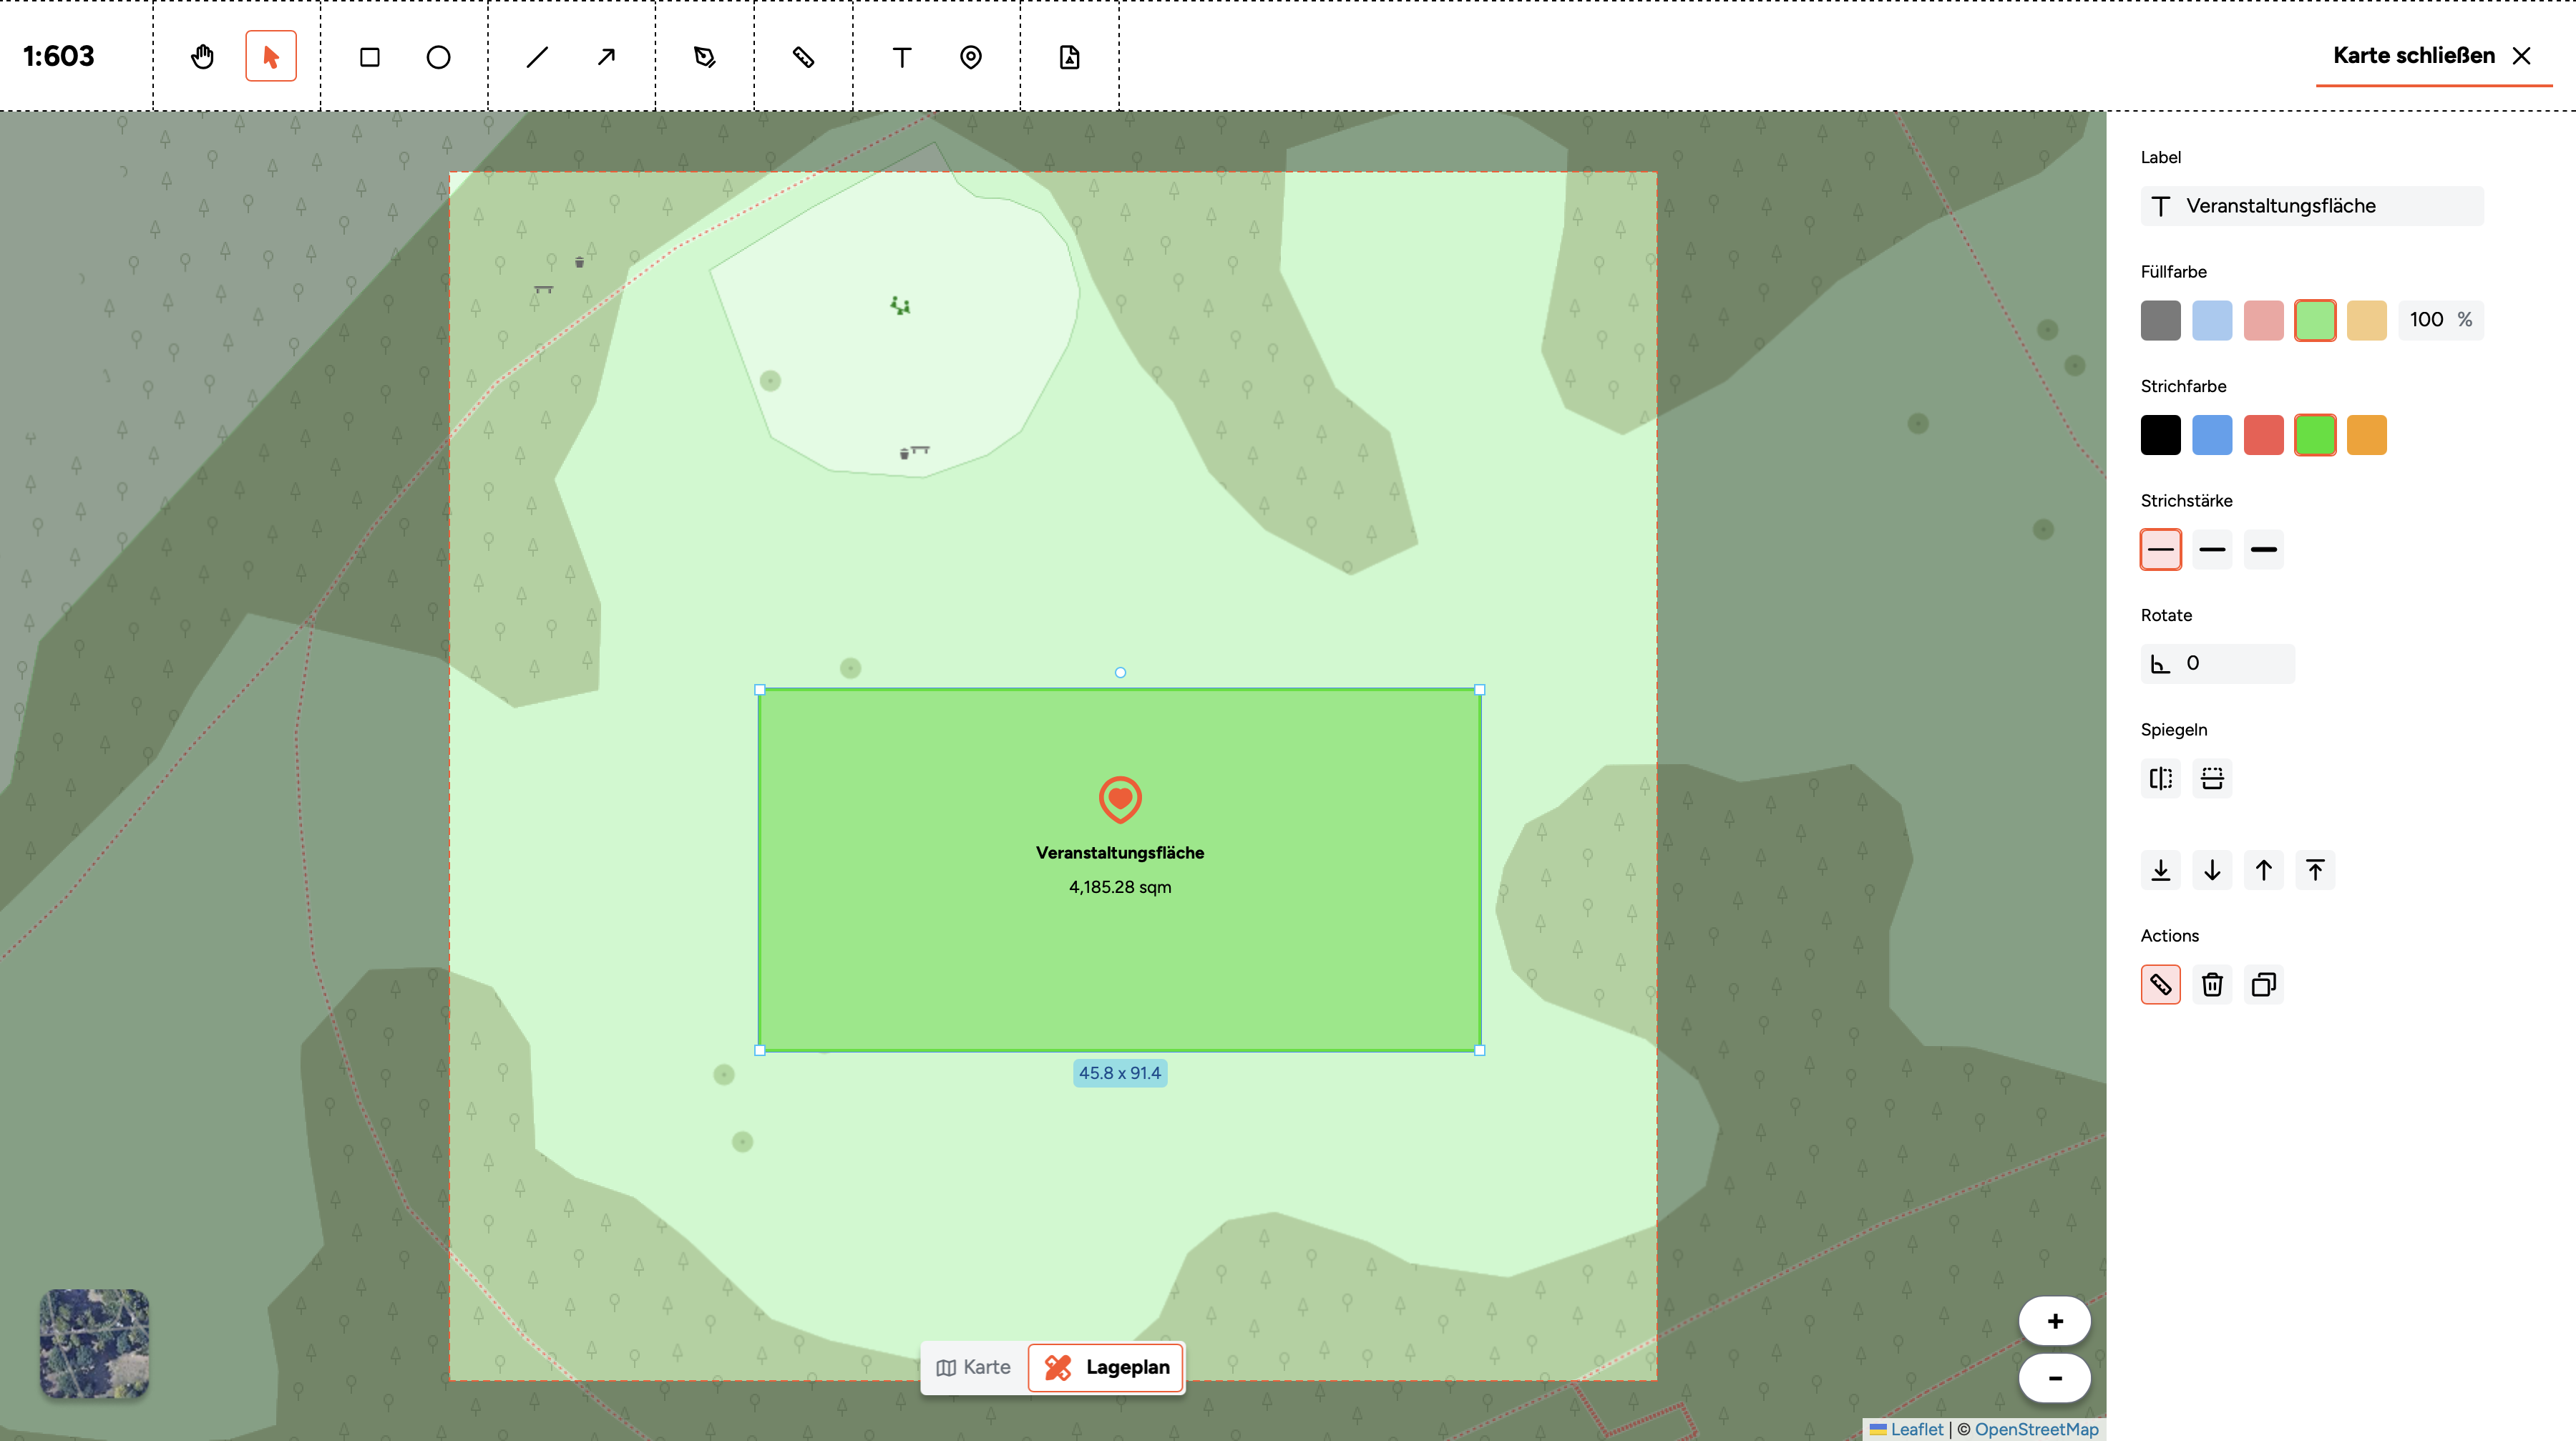
When you select a drawn element, the right-hand column displays its properties. Here you can adjust the following:
- Label – Add or edit a text label for the selected element. This text will appear on the element in your plan and in the drawing legend.
- Fill colour – Choose from a set of preset colours for the interior of the shape. You can also adjust the opacity percentage to make elements semi-transparent – useful when overlapping areas need to remain visible beneath one another.
- Stroke colour – Set the colour of the element's outline, independent of the fill colour.
- Stroke width – Choose between three line thicknesses for the element's outline (thin, medium, or thick).
- Rotate – Rotate the selected element by entering a degree value (e.g. 180°).
- Mirror – Flip the selected element horizontally or vertically.
- Arrange – Change the layering order of overlapping elements. You can move a selected element to the front, to the back, or one layer forward or backward. This is helpful when elements overlap and you need to control which one appears on top.
- Actions – Three operations for the selected element:
- Measure (ruler icon) – Display the area of a shape and the length of its perimeter in metres.
- Delete – Remove the selected element from the plan.
- Copy – Duplicate the selected element.
These controls allow you to create a clear, well-organised plan where each element is easy to identify and distinguish from the others.
Note: Use the measure tool to check the dimensions of your key elements. The approval authorities will expect your site plan to show the area measurements of the overall event space as well as individual structures such as stages, seating areas, dance floors, tents, and containers. Including these measurements in your plan helps demonstrate that your layout is well considered and fits within the available space.
Preparing and Exporting the Final Drawing
When your plan is complete, click the PDF button in the toolbar above the map to switch to print mode. In print mode, the right-hand column displays the drawing header fields.
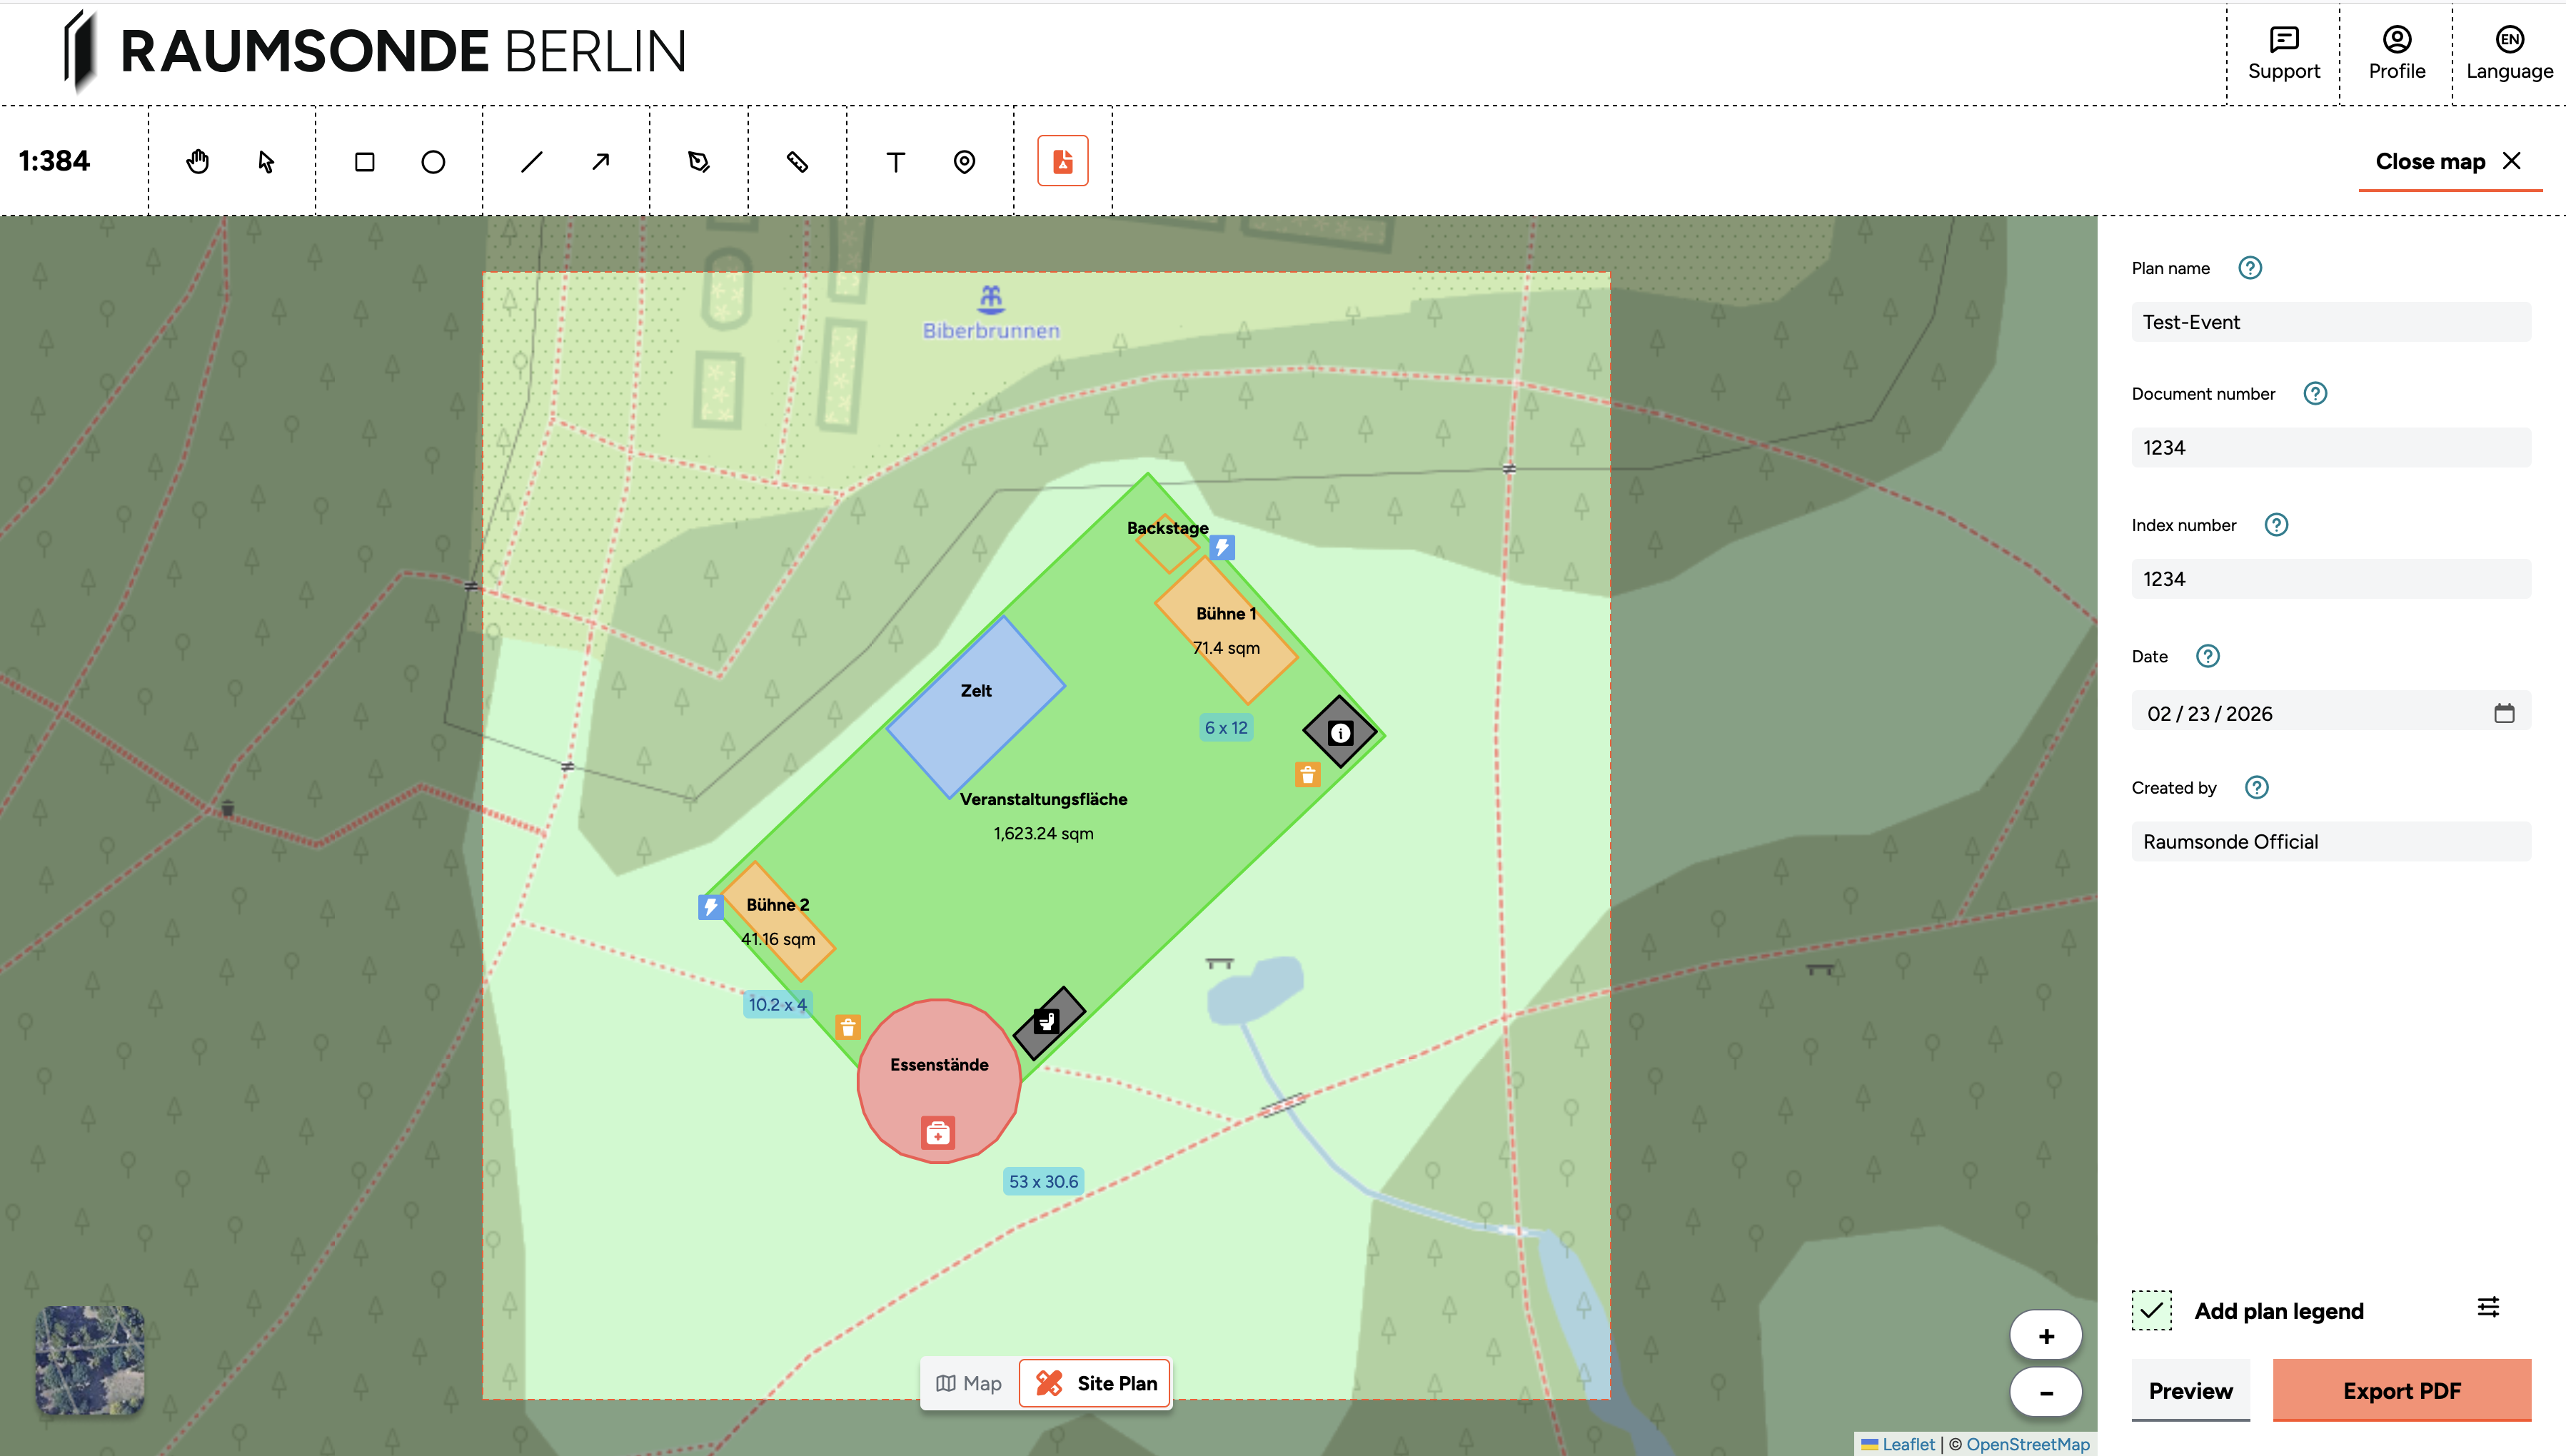
Fill in the following information:
- Plan name – Give your drawing a descriptive title.
- Document number – Assign a reference number for administrative use and correspondence.
- Index number – Add a version indicator (e.g. A, B, C or 1, 2, 3) so you can track revisions over time.
- Date – Record when the drawing was created or last updated.
- Created by – Enter the name or initials of the person who prepared the plan.
At the bottom of the column, you can click Add plan legend to configure the legend for your drawing. The legend is generated automatically from the shapes you have drawn. In the legend editor, you can select which items to include and label them. Items that share the same icon and colour combination are grouped together – if you want them to appear as separate entries in the legend, use different combinations of fill and stroke colours in your drawing. The legend appears as a separate appendix to the plan, not on the drawing itself.
Set the final scale so that all drawn elements fit within the boundaries of the A3 output. The print preview shows exactly how much of the map will be visible at the selected scale.
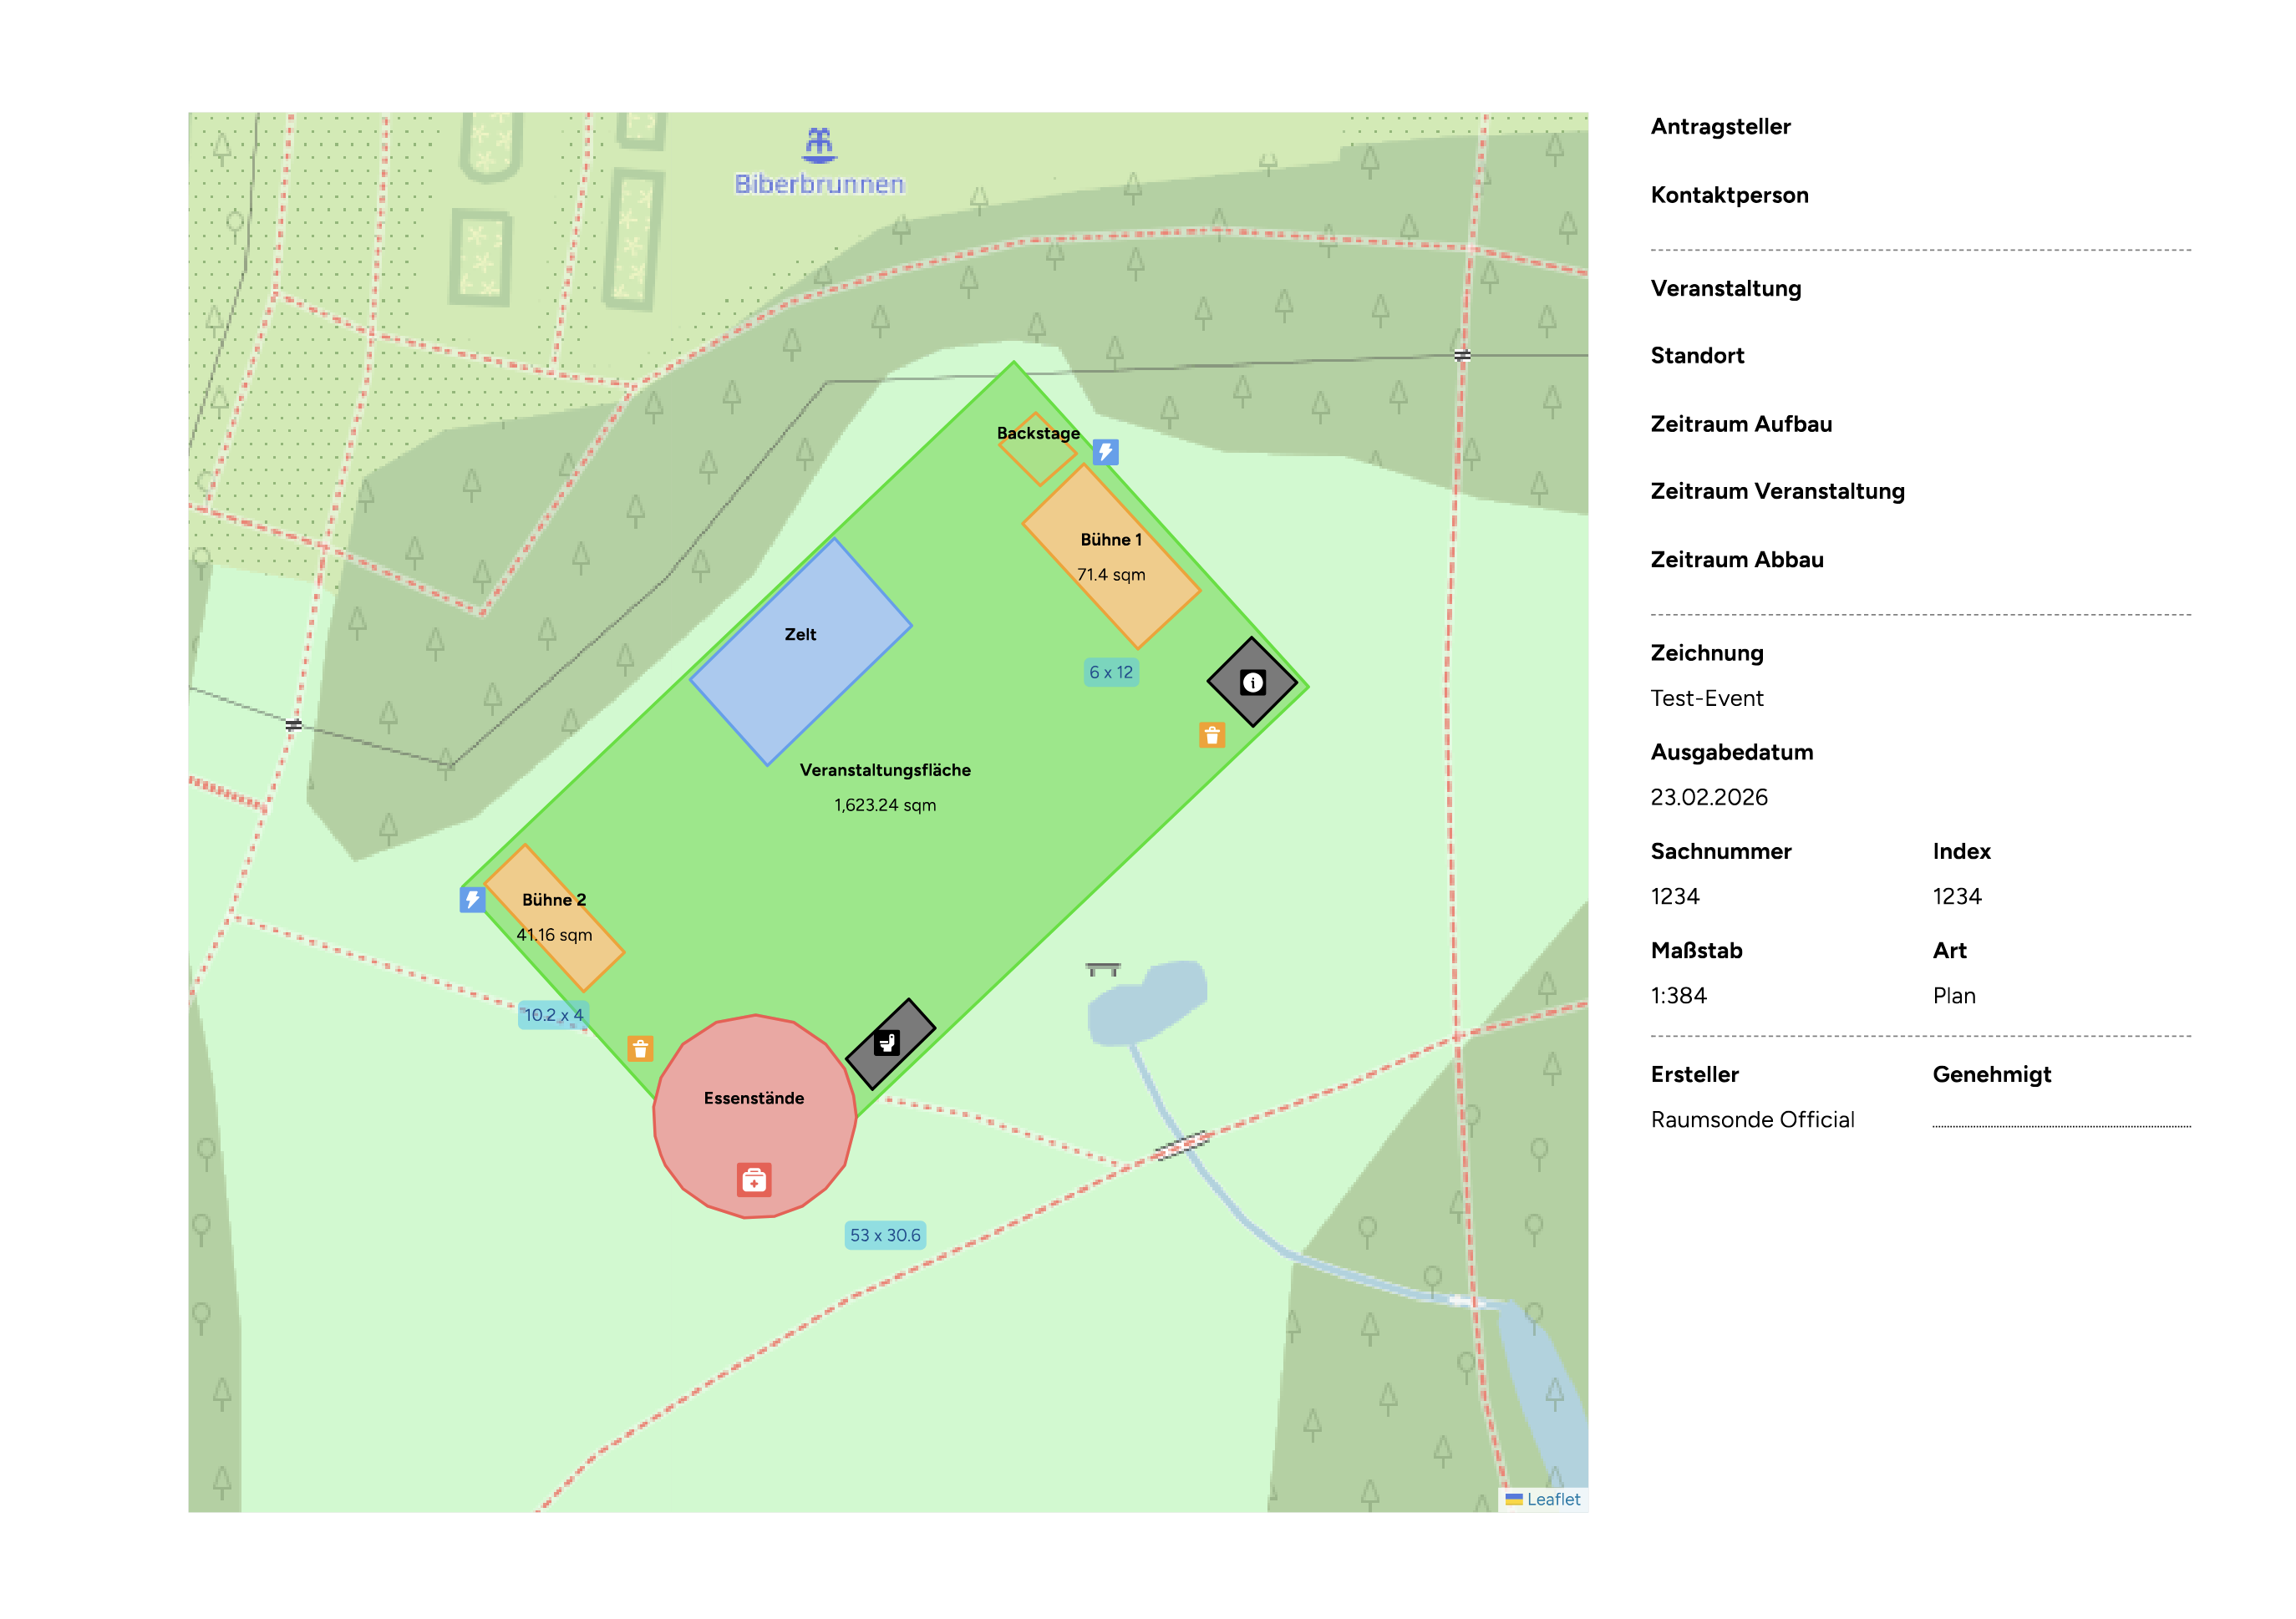
Click Preview to view a mock-up of your drawing in DIN A3 format. Once you are satisfied, click Export PDF to save it as a PDF file.
All drawn items remain saved within your application. You can return to the drawing at any time, make changes, and export a new version. If you export a revised layout for submission, remember to update the date and index number in the header fields.
Note: There is no save button in the Site Planner – your drawing is saved automatically as you work. Even if you close the map or navigate away from the page, all your drawn elements and settings are preserved. You can pick up where you left off at any time by returning to your application.